


A Venn diagram is something you will have probably seen before. It's two circles that cross over in the middle.
They look something like this:
This does look a bit complicated to start with, until you dig down to what it all means.
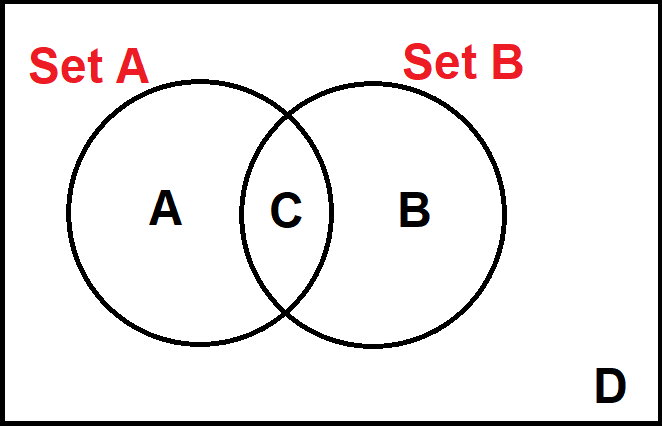
A set is just a list of data, whether it is numbers, colours or something else - so Set A and Set B are just a couple of lists.
The letter A is where we put the things that are in set A but not in Set B.
The letter B is where we put the things that are in Set B but not in Set A.
The letter C is where we put the things that are in both lists.
The letter D is where we put the things that aren't in either of the two sets.
Example:
In a class of 30 students, 5 are in the chess club and 7 are in the debating club. There are 2 students who are in both clubs.
Draw a Venn diagram to illustrate this.
Set A is the chess club, Set B is the debating club
We know that there are 2 students in both clubs, so C = 2
We know that there are 5 students in the chess club but that 2 of them are also in the debating club.
5 - 2 = 3 This means that A = 3
We know that there are 7 students in the debating club but that 2 of them are also in the chess club. This means that B = 5
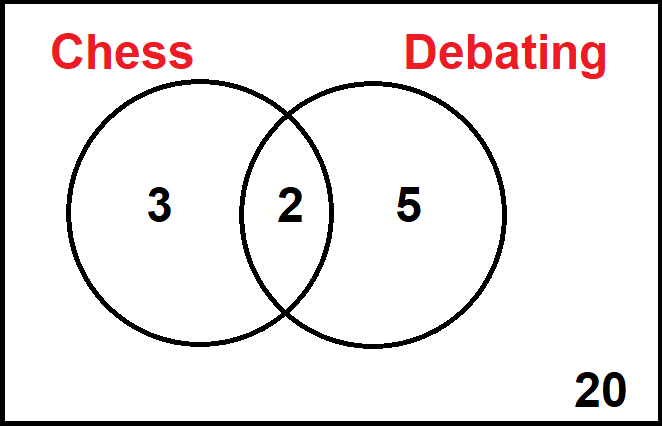
So far, we have A = 3, B = 5 and C = 2. This accounts for 10 of the 30 students. This means that there are 20 students who are in neither club, so D = 20
We can now create our Venn diagram:
We can then use this Venn diagram to calculate the probability of a student selected at random being in a given set.
Example 2:
A student is picked at random. What is the chance that he is in the chess club and the debating club?
There are only two students that fit here, so this gives our probability as 2/30 which equals 1/15
Let's have a go at some questions now.


