

Mrs. Bates's science class were investigating dissolving. They wanted to find out whether the amount of sugar that dissolved in water changed as the temperature increased.
Mrs. Bates gave each group:
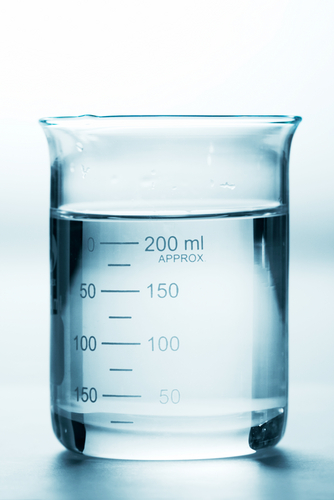
- a plastic beaker
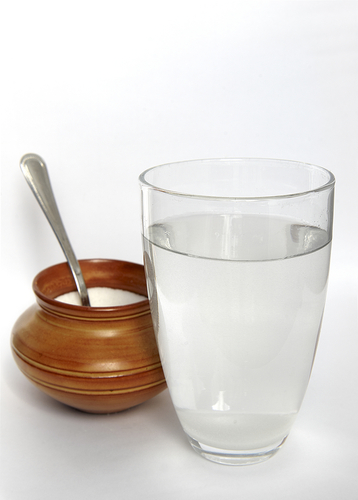
- a bowl of sugar
- a teaspoon
- a weighing balance
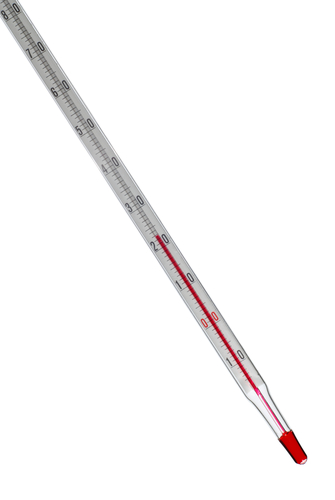
- 200 ml of water that she had prepared at a particular temperature.
The young scientists then weighed out their sugar, adding it to their beaker of water, stirring it until it had all dissolved.
They made sure that they kept track of the amount of sugar they had added.
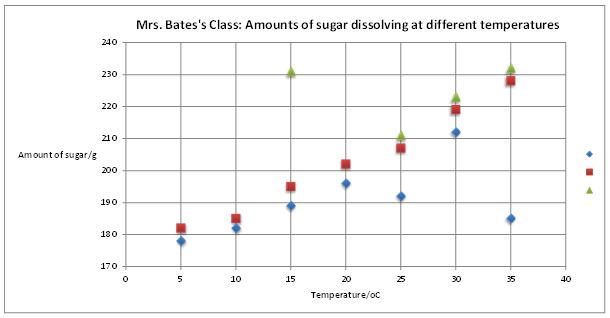
When they had all finished and noted down how much sugar they had been able to dissolve in their beaker of water, Mrs. Bates asked for their results which she plotted on this graph:
Before you tackle the following questions, try to imagine you're one of the young scientists in the class and read this through again.

OK? Ready? Let's work out what the class have found out...


