Loading please wait

The smart way to improve grades

Comprehensive & curriculum aligned

Try an activity or get started for free

Solve Problems Using a Pictogram and a Bar Chart

In this worksheet, students will answer one-step addition or subtraction questions by reading information from a pictogram.

'Solve Problems Using a Pictogram and a Bar Chart' worksheet

Key stage:  KS 2

Year:  Year 3 Maths worksheets

Curriculum topic:   Statistics

Curriculum subtopic:   Interpret and Present Data

Difficulty level:  

Worksheet Overview

In this activity, we will learn about how to use the information shown in a simple bar chart to answer questions.


The bar chart below shows the result of a survey about cupcake flavours.


bar chart
 

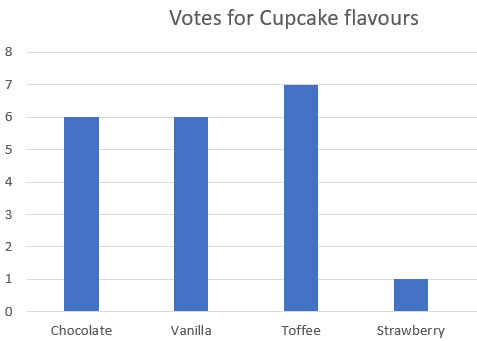
We can see that chocolate got six votes. 

Strawberry was the least popular.


Let's try some example questions using the bar chart. 


Example 1

How many people voted for vanilla?


Answer

To find the answer, we need to look very carefully at the bar chart. 

The vanilla bar, goes up to the 6 on the scale on the left-hand side.

So, vanilla got 6 votes. 

cup cake


Let's try some questions now.

What is EdPlace?

We're your National Curriculum aligned online education content provider helping each child succeed in English, maths and science from year 1 to GCSE. With an EdPlace account you’ll be able to track and measure progress, helping each child achieve their best. We build confidence and attainment by personalising each child’s learning at a level that suits them.

Get started
laptop

Try an activity or get started for free

  • National Tutoring Awards 2023 Shortlisted / Parents
    National Tutoring Awards 2023 Shortlisted
  • Private-Tutoring-WINNER-EducationInvestor-Awards / Parents
    Winner - Private Tutoring
  • Bett Awards Finalist / Parents
    Finalist
  • Winner - Best for Home Learning / Parents
    Winner - Best for Home Learning / Parents