Loading please wait

The smart way to improve grades

Comprehensive & curriculum aligned

Try an activity or get started for free

Statistics: Interpreting Line Graphs

In this worksheet, students read information from a line graph and answer questions about it.

'Statistics: Interpreting Line Graphs' worksheet

Key stage:  KS 2

Year:  Year 4 Maths worksheets

Curriculum topic:   Statistics

Curriculum subtopic:   Present Data Using Charts and Graphs

Difficulty level:  

Worksheet Overview

This worksheet is about reading information from a line graph about the height of a tomato plant during 11 weeks of growth.


Tomato plant Height of tomato plant (cm)
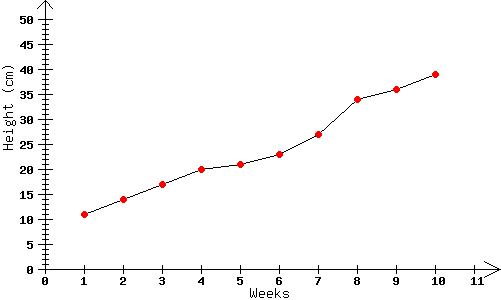
Height of tomato plant


Example

What was the height of the plant at the end of week 2? 


Answer

To find the answer, look at the point where the height and number of weeks (2) meet.

Each little mark on the height scale is worth 1 cm.

The answer is 14 cm.


What is EdPlace?

We're your National Curriculum aligned online education content provider helping each child succeed in English, maths and science from year 1 to GCSE. With an EdPlace account you’ll be able to track and measure progress, helping each child achieve their best. We build confidence and attainment by personalising each child’s learning at a level that suits them.

Get started
laptop

Try an activity or get started for free