


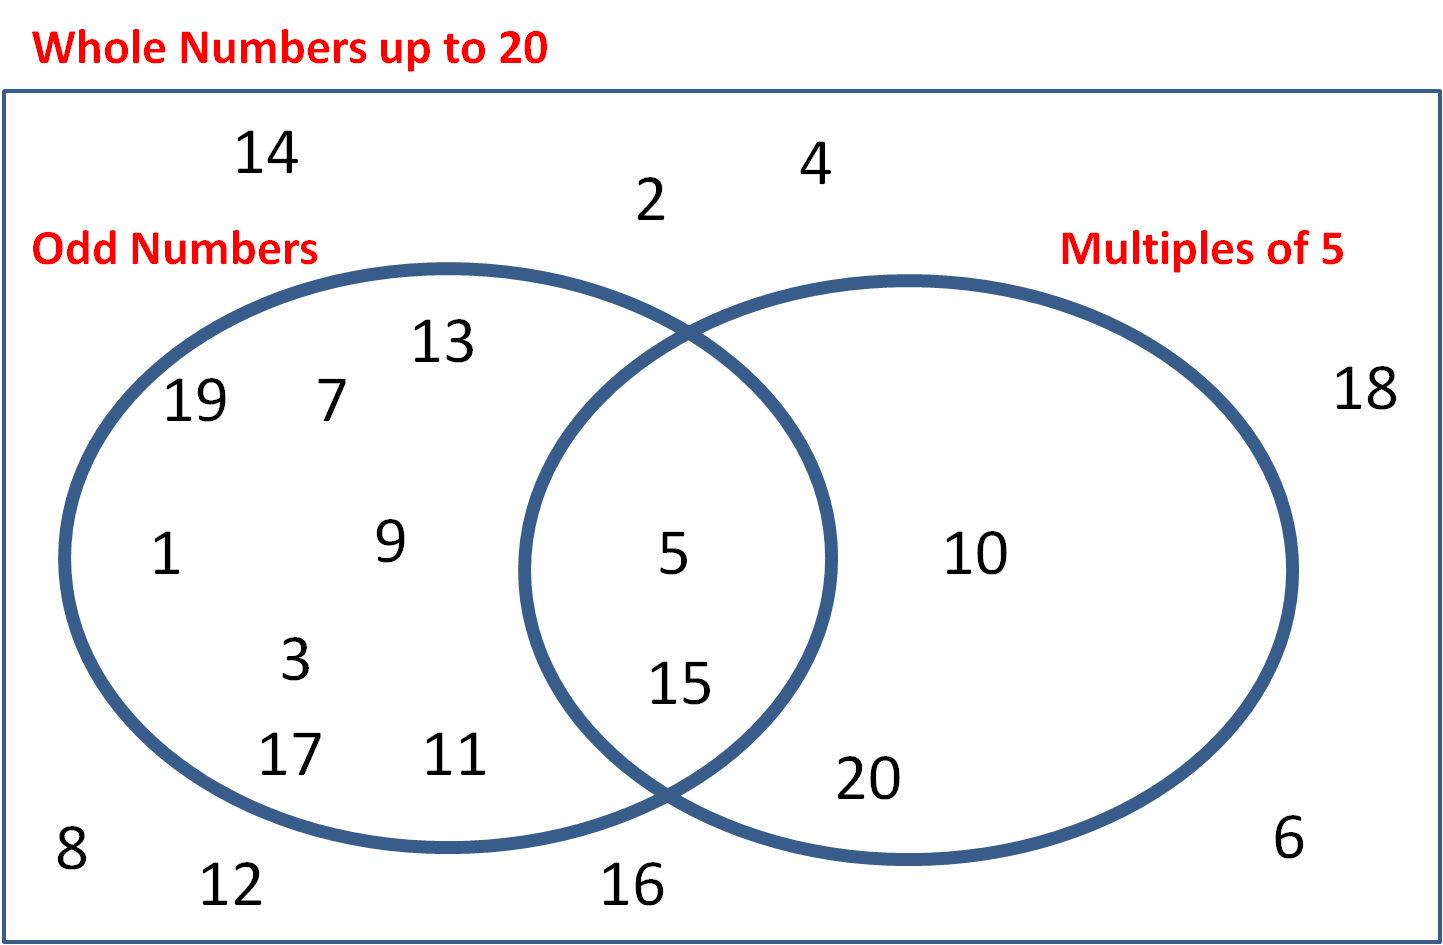
This Venn Diagram shows information inside two circles in a rectangular grid.
Check the numbers in this Venn Diagram, making sure that you understand why each number is where it is.
The numbers in the left-hand circle are odd.
The numbers in the right-hand circle are multiples of 5.
The numbers in the section where the circles overlap are both odd and multiples of 5.
Numbers outside the circles are whole numbers up to 20, that are neither odd nor multiples of 5
Does that make sense?

Let's get started.


