Loading please wait

The smart way to improve grades

Comprehensive & curriculum aligned

Try an activity or get started for free

Retrieve Data about Cars From a Table of Results

In this worksheet, students will answer questions using the results of a survey shown in a data table.

'Retrieve Data about Cars From a Table of Results' worksheet

Key stage:  KS 2

Year:  Year 4 Maths worksheets

Curriculum topic:   Statistics

Curriculum subtopic:   Compare Data Using Charts and Graphs

Difficulty level:  

Worksheet Overview

In a survey, Class A counted the number of different coloured cars passing a school gate on three consecutive mornings.


The results are shown below.


Car table


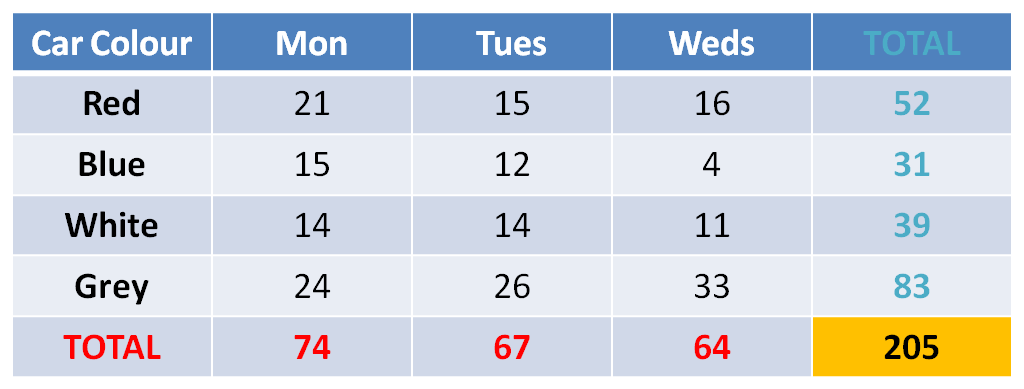
From this we can tell that....

74 cars passed the school on Monday and 21 of these were red.

52 red cars passed the school in total over the three days.


Have a look at the chart and compare it with the statements written above. Can you see how we found out that information?


Brilliant - in that case, we're ready to roll!


a red car

What is EdPlace?

We're your National Curriculum aligned online education content provider helping each child succeed in English, maths and science from year 1 to GCSE. With an EdPlace account you’ll be able to track and measure progress, helping each child achieve their best. We build confidence and attainment by personalising each child’s learning at a level that suits them.

Get started
laptop

Try an activity or get started for free

  • National Tutoring Awards 2023 Shortlisted / Parents
    National Tutoring Awards 2023 Shortlisted
  • Private-Tutoring-WINNER-EducationInvestor-Awards / Parents
    Winner - Private Tutoring
  • Bett Awards Finalist / Parents
    Finalist
  • Winner - Best for Home Learning / Parents
    Winner - Best for Home Learning / Parents