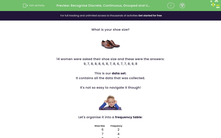
What is your shoe size?

14 women were asked their shoe size and these were the answers:
9, 7, 8, 8, 8, 6, 8, 7, 8, 6, 7, 7, 8, 9, 8
This is our data set.
It contains all the data that was collected.
It's not so easy to navigate it though!

Let's organise it into a frequency table:
| Shoe Size | Frequency |
|---|---|
| 6 | 2 |
| 7 | 4 |
| 8 | 6 |
| 9 | 2 |
Frequency tells us how many times something occurred.
For example, the first line of the table tells us that there were 2 data points that were equal to 6.
Indeed, there were 2 times in our data set that the shoe size was 6!
If we want to organise data into a frequency table, we simply find how many times each value appears to get our frequencies!
When the data is written as a list, as at the beginning of the activity, then it is called ungrouped data (or raw data).
When the data is organised using frequencies, i.e. grouped, it is called grouped data.
So we have grouped and ungrouped data.
But we can also divide data into two more pairs of categories:
1) discrete vs continuous
and
2) quantitative vs qualitative
The shoe sizes were an example of discrete data.
Discrete data is data that can only take on specific values,
e.g. a shoe size cannot be 6.135!
On the other hand, continuous data can take on any value within a specified range.
Students' time to run 100 m would be an example of continuous data.
It could be 14.27 s or 18.91 s - any kind of number!

All of the examples we have seen so far are examples of quantitative data.
This essentially means that the data points are all numbers.
What could qualitative data be then?
Anything but numbers!
For example, if we asked for favourite colour or people's birth towns, the answers will definitely not be numbers!
(Or do you know colour "12"?! )
That's a lot of information, so remember that you can look back at the introduction at any point by clicking on the red help button on the screen.
.jpg)
Let's have a go at some questions!


