Loading please wait

The smart way to improve grades

Comprehensive & curriculum aligned

Try an activity or get started for free

Read and Interpret Pictograms

In this worksheet, students will read pictograms.

'Read and Interpret Pictograms' worksheet

Key stage:  KS 3

Year:  Year 8 Maths worksheets

Curriculum topic:   Statistics

Curriculum subtopic:   Construct/Interpret Appropriate Representations for Data

Difficulty level:  

Worksheet Overview

Do you remember pictograms?


girl thinking


A pictogram is a type of chart that uses pictures or symbols to represent numerical data - like this one:


pictogram


It represents the number of chocolate bars sold on a charity fundraising stand each day.


We can see the pictogram includes a key:


We use it to find how many chocolate bars were sold each day.

For example, on Tuesday, we have:


which is the same as


Since each of the full bars is 8:


we have:


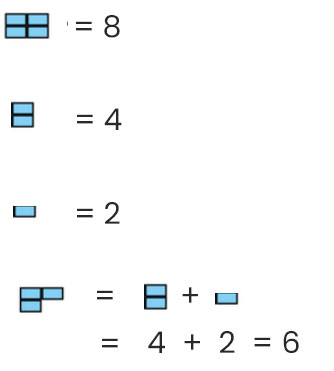
Hence we get 8 + 8 +  6 = 22 chocolate bars!


bar of chocolate


Let's have a go at some questions!

What is EdPlace?

We're your National Curriculum aligned online education content provider helping each child succeed in English, maths and science from year 1 to GCSE. With an EdPlace account you’ll be able to track and measure progress, helping each child achieve their best. We build confidence and attainment by personalising each child’s learning at a level that suits them.

Get started
laptop

Try an activity or get started for free

  • National Tutoring Awards 2023 Shortlisted / Parents
    National Tutoring Awards 2023 Shortlisted
  • Private-Tutoring-WINNER-EducationInvestor-Awards / Parents
    Winner - Private Tutoring
  • Bett Awards Finalist / Parents
    Finalist
  • Winner - Best for Home Learning / Parents
    Winner - Best for Home Learning / Parents