


What do you imagine when you hear 'tree diagrams'?

A tree diagram is a diagram displaying the possible outcomes (and their respective probabilities) of a series of events.
The probability of the next event happening might be different based on the outcome of the previous events.
So a tree diagram is particularly helpful for representing all the different scenarios, i.e. the different branches - just like in trees!
Let's have a look at an example:

The probability that my bus is on time on any day is 0.7.
The tree diagram for the events 'bus being on time on Monday' and 'bus being on time on Tuesday' would look like this:
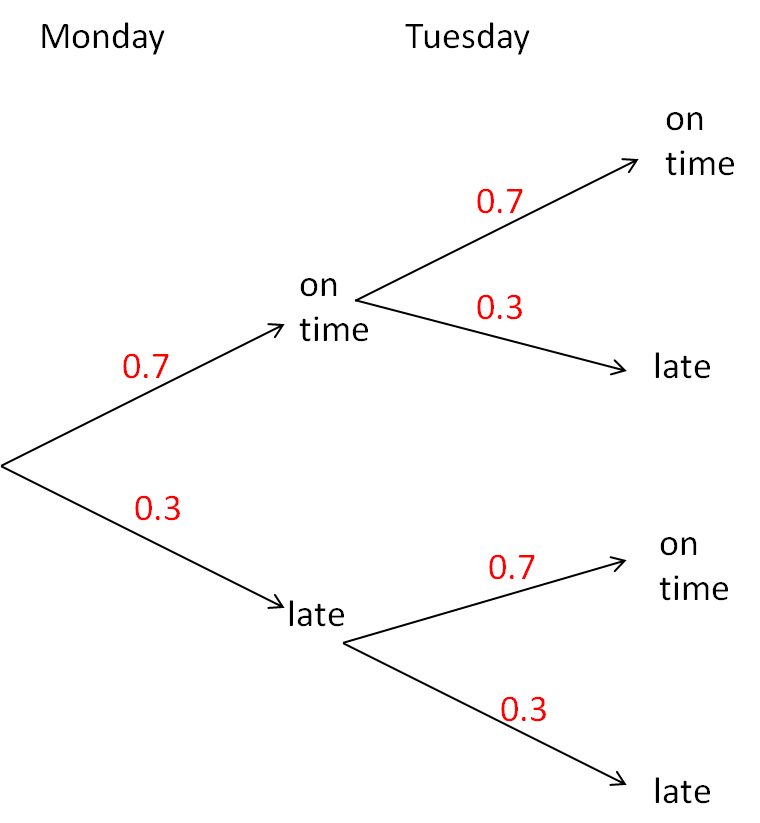
The probability that it is on time on any day is 0.7
So the probability that it is late (i.e. not on time) on any day is 1 - 0.7 = 0.3
We can see that all the branches coming from a single point add up to 1.
This will always happen and you can use it to either find a missing probability (like we did with 0.3) or check that you filled out the tree diagram correctly.
In the example above, we had the same branches each time (0.7 and 0.3).
But this doesn't always happen!

Let's say that there is a different driver on the bus on Monday and Tuesday and the Monday driver always takes much longer to leave the station.
Then the probability that the bus is on time on Monday is 0.4 and on Tuesday it is 0.7.
The tree diagram would then look like this:
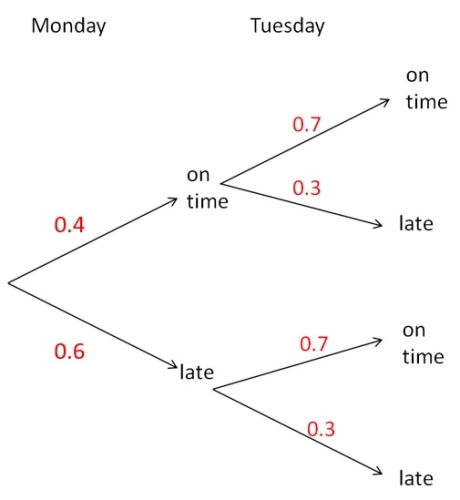
Again, the missing probability of the bus being late on Monday was calculated by subtracting from 1:
1 - 0.4 = 0.6
Ready to have a go at some questions?
.jpg)


