


What is a variable?

We can actually tell from the name! A variable is a quantity that varies, i.e. takes different values.
One variable on its own is not that interesting - but when we have two (or even more!) of them, we can investigate the relationship between them.
To do so, we often create a scatter graph from the data collected on the two variables.
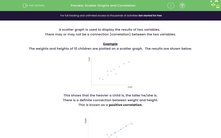
For example, here is a scatter graph where the heights (one variable) of 10 children were plotted against their weights (the other variable) of those children:
Let's remember that when we say something was 'plotted against' something else, it just means the first thing (e.g. heights here) is on the y-axis and the variable it was plotted against (e.g. the weights here) is on the x-axis.
The scatter graph shows us that the higher weight a child has, the taller he/she is.
There is a definite connection between weight and height.
When one variable increases as the other increases ('the higher x is, the higher y is'), we have a positive correlation.
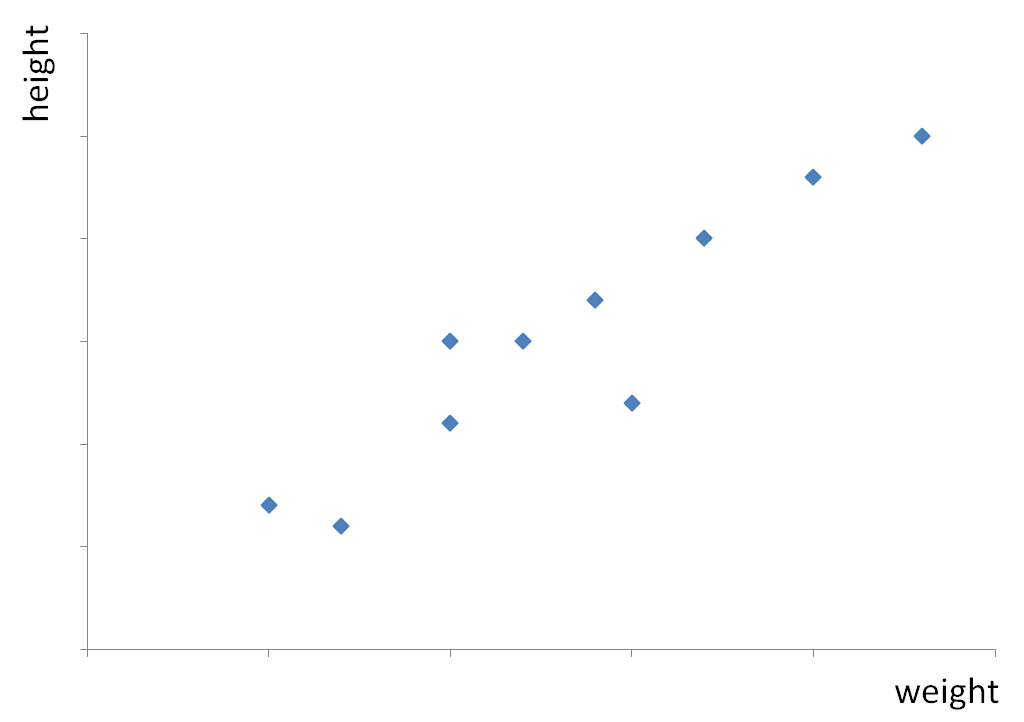
We can draw a line that best fits this data. It goes in the direction of the plotted points and has roughly the same number of points above it as below.
It is known as the line of best fit.
.jpg)
The following scatter graphs show negative correlation (the points are going 'down') and no correlation (the points are 'random' - there is no pattern).
.png)
.png)
negative correlation no correlation
It would be possible to draw a line of best fit on the graph with negative correlation, but not on the one with no correlation.
Shall we have a go at some questions now?


