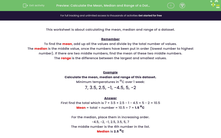
What comes to mind when someone says 'average'?

It could mean typical or ordinary - like when you have an average meal: it's ok but nothing outstanding!
But if we are thinking about maths, mean, mode or median could come to mind!
In this activity, we will focus on mean and median.
Mean is the arithmetical average.
We calculate it by adding up all the values and dividing by the total number of values.
For example, if we consider the minimum temperatures in oC over 1 week:
7, 3.5, 2.5, -1, -4.5, 5, -2
Then we find the sum of all the values first:
7 + 3.5 + 2.5 - 1 - 4.5 + 5 - 2 = 10.5
Since there are 7 numbers, we get:
Mean = sum of values ÷ number of values = 10.5 ÷ 7 = 1.5 oC
On the other hand, median is the middle value when you place the values in ascending order (lowest number to highest number).
If we wanted to find the median of our temperatures from before for example, we first place them in increasing order:
-4.5, -2, -1, 2.5, 3.5, 5, 7
We can cross one from each side until we find the middle number is the 4th number in the list:
-4.5, -2, -1, 2.5, 3.5, 5, 7
Median is 2.5 oC
Let's have a look at one more example:
A researcher is looking at the weekly study hours of a group of students. She has collected the following data:
Putting these in ascending order and crossing one from each side, we get:
But wait - here we ended up with two numbers in the middle!
If this happens, the median is the number right between of these two numbers.
In this case, the median is the number in the middle between 7 and 8, i.e. 7.5.
If we can't spot what number is in the middle though, we can always find it by calculating the mean of the two numbers!
(7 + 8) ÷ 2 = 15 ÷ 2 = 7.5
.jpg)
Let's have a go at some questions!


