

So far, you have looked at velocity-time graphs where the lines have been straight. In those questions, the velocity (or speed) has been constant.
In real life, this would be an unusual situation as objects rarely travel at a constant velocity when they are accelerating.
It is more likely that if you sketch a real life example, you would get a curve.
When you have a velocity-time graph, you can work out the distance by finding the area under the graph.
When you have one with straight lines, this is really easy as you can split the graph into shapes and then find the area.
So how does this work for a curve?
Learn to love the word estimate!
When you have a velocity-time graph, you are not asked to find the distance travelled, but to estimate the distance travelled.
This means that you don’t have to find it exactly - you can split the area under the graph into strips that you can then find the area of, giving you an estimate of the total distance travelled.
Example:
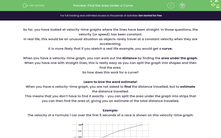
The velocity of a Formula 1 car over the first 5 seconds of a race is shown on this velocity-time graph:
Using five strips of equal width, estimate the distance travelled in the first 5 seconds.
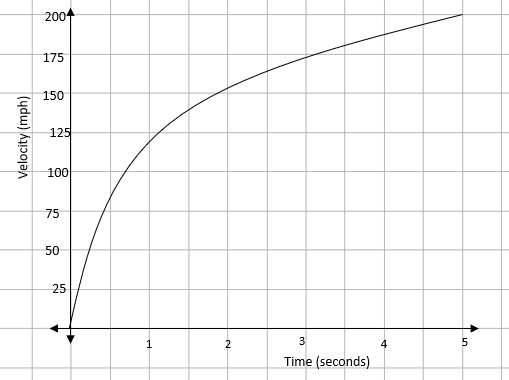
Our first task is to split the area under the graph into five equal strips:
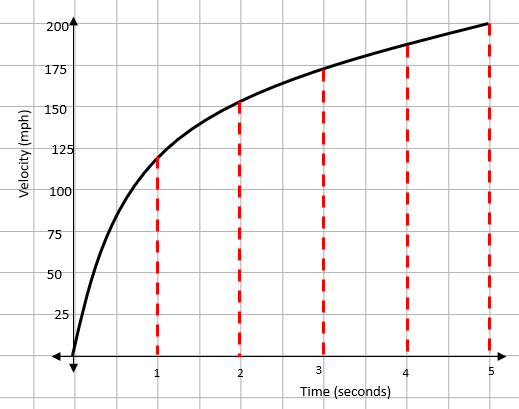
Once we have this, we can draw lines between the tops of the strips to form one triangle and four trapeziums.
At this stage, we can find the area of each of the strips. Remember that to find the area of a trapezium, you need to add the two parallel sides together and divide that by two.
Aa = ½ x 1 x 120 = 60
Ab = ½ x (120 + 155) x 1 = 137.5
Ac = ½ x (155 + 172) x 1 = 163.5
Ad = ½ x (172 + 185) x 1 = 178.5
Ae = ½ x (185 + 200) x 1 = 192.5
Adding these all together gives an estimate of the distance travelled as 732 metres.
Is your answer an underestimate or an overestimate?
This is all to do with the lines you drew between the tops of the strips. In this example, these lines are underneath the curve.
This means it is an underestimate.
If they were above the curve, it would be an overestimate.
Time for some questions.


