

In other activities, we have looked at distance-time and velocity-time graphs where the lines have been straight. In these questions, the gradient (or rate of change) of the diagonal lines has given the time (for a distance-time graph) and the acceleration (for a velocity-time graph).
In real life, this is a false situation as objects rarely travel or accelerate at a constant rate.
It is more likely that if you sketched either of these graphs, you would get a curve.
So this begs the question, how do you find the gradient when you have a curve?
Average and instantaneous
These questions can take one of two forms.
The following details are referring to velocity-time graphs, but the same rules apply for distance-time, just replace the word acceleration with the word velocity.
You are asked for the average acceleration. In these questions, you are finding the acceleration between two points. All you have to do is draw a straight line between the two points and find the gradient of that line.
You are asked for the acceleration at a specific time - this is called the instantaneous acceleration.
For these questions you are finding the gradient at a given point on the graph. Without going into calculus (this is still an A-level only topic), all you need to know is that the gradient of a curve at a point is the same as the gradient of the tangent at that point.
Example:
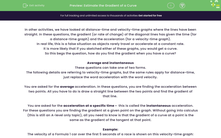
The velocity of a Formula 1 car over the first 5 seconds of a race is shown on this velocity-time graph:
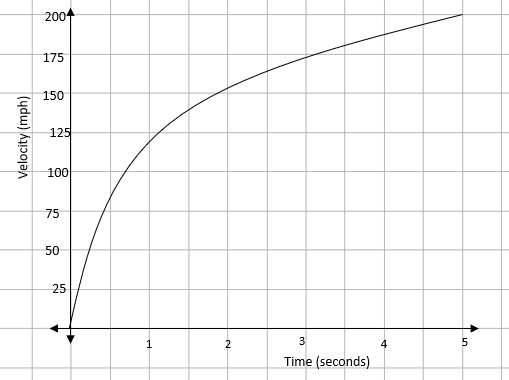
Find the average acceleration over the first 3 seconds.
Average means that we are looking for the acceleration between t = 0 and t = 3. We need to draw a line between these two points on the graph and find the gradient.
This gives an average acceleration of 57.3 m/s2
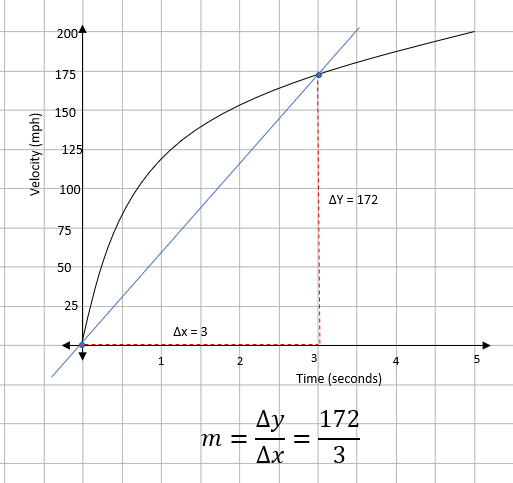
Find the acceleration 2 seconds after the start of the race.
In this question, we are asked for the acceleration at a specific point - this means that we have an instantaneous rate of change. We need to draw a tangent at t = 2 and find the gradient at this point.
This gives an instantaneous acceleration of 23.1 m/s2


