


When we are working with inequalities, we can illustrate these by either using a number line (if it has a single variable) or on a set of axes (if it has double variables).
We can also illustrate the region on a graph that satisfies numerous inequalities.
A reminder about which lines to use:
If the inequality you are drawing contains either a > or < symbol, you should draw a dashed line.
If the inequality contains either a ≥ or ≤ symbol, you should draw a solid line.
e.g. Illustrate the region that satisfies the inequalities:
x > 2, y ≥ x and x + y < 8
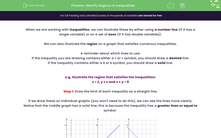
Step 1: Draw the limit of each inequality as a straight line.
If we draw these on individual graphs (you won’t need to do this), we can see the lines more clearly.
Notice that the middle graph has a solid line, this is because the inequality has a greater than or equal to symbol.
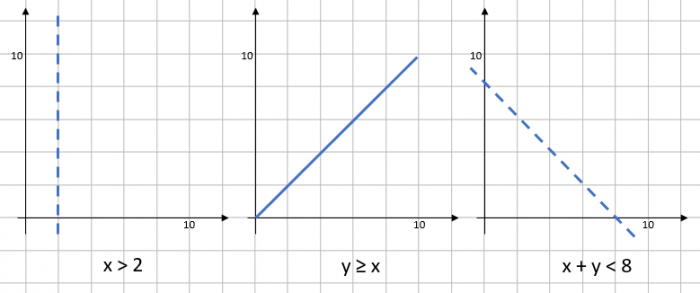
Usually, we would actually draw all of these onto one graph, like this:
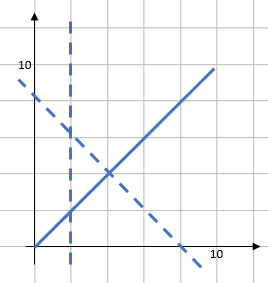
Step 2: Illustrate the region that satisfies all three inequalities.
There’s a short cut we can use here.
There is only one section that works for all the inequalities - the bit in the middle of all three lines (shaded grey here):
Let's extend from this starting question now.
e.g. Are the points below in the region defined by the inequalities x > 2, y ≥ x and x + y < 8?
a) (3,4)
b) (2,6)
c) (3,3)
If we plot these on the graph we previously created, they will appear like this:
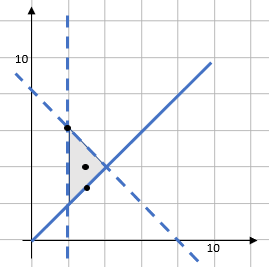
a) (3,4) – This is in the middle of the region so it is definitely within the region.
b) (2,6) – This is on a dashed line. As a dashed line means > or <, points on the line don’t count as being inside the region.
c) (3,3) – This point is on a solid line. A solid line means ≥ or ≤ so the line itself is included in the region.
Did you follow those examples?
Are you ready to investigate some regions independently now?
You may want to have some squared paper and a pencil handy in case you want to draw any of these graphs to compare with our maths teacher's versions.


