Loading please wait

The smart way to improve grades

Comprehensive & curriculum aligned

Try an activity or get started for free

Compare Data from a Venn Diagram on Fruit and Vegetables

In this worksheet, students will study a Venn diagram to decide where different fruit and vegetables are grown.

'Compare Data from a Venn Diagram on Fruit and Vegetables' worksheet

Key stage:  KS 1

Year:  Year 2 Maths worksheets

Curriculum topic:   Statistics

Curriculum subtopic:   Charts and Diagrams

Difficulty level:  

Worksheet Overview

In this activity, we will read information from a Venn diagram.


 Fruit and vegetables


 The Venn diagram shows which fruit and vegetables are normally grown in the UK.


Venn diagram of fruit and veg grown


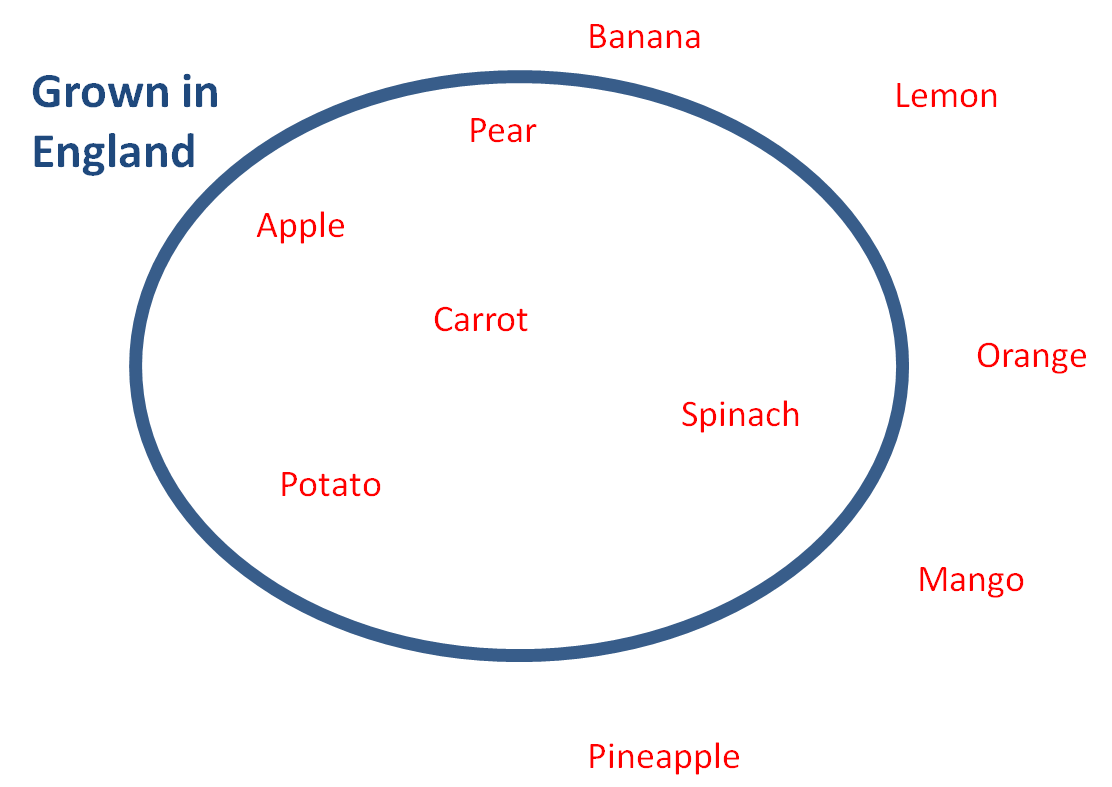
The fruit and vegetables inside the oval shape are grown in the UK.

The fruit and vegetables outside the oval shape are not normally grown in the UK.


Note that the Venn diagram actually says grown in 'England', but in fact the information is the same for all the other parts of the United Kingdom (UK.), so try to imagine that it says 'Grown in the UK.' instead!!


Let's have a go at some questions on this now.


bunch of carrots

What is EdPlace?

We're your National Curriculum aligned online education content provider helping each child succeed in English, maths and science from year 1 to GCSE. With an EdPlace account you’ll be able to track and measure progress, helping each child achieve their best. We build confidence and attainment by personalising each child’s learning at a level that suits them.

Get started
laptop

Try an activity or get started for free

  • National Tutoring Awards 2023 Shortlisted / Parents
    National Tutoring Awards 2023 Shortlisted
  • Private-Tutoring-WINNER-EducationInvestor-Awards / Parents
    Winner - Private Tutoring
  • Bett Awards Finalist / Parents
    Finalist
  • Winner - Best for Home Learning / Parents
    Winner - Best for Home Learning / Parents