Loading please wait

The smart way to improve grades

Comprehensive & curriculum aligned

Try an activity or get started for free

Sort Data From a Block Graph

In this worksheet, students will interpret data from a block graph on how a class of pupils travels to school.

'Sort Data From a Block Graph ' worksheet

Key stage:  KS 1

Year:  Year 2 Maths worksheets

Curriculum topic:   Statistics

Curriculum subtopic:   Counting and Sorting Data

Difficulty level:  

Worksheet Overview

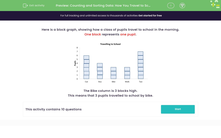
Here is a block graph showing how a class of pupils travel to school in the morning.


One block represents one pupil.


block graph t show travel to school


The bike column is 3 blocks high.

This means that 3 pupils travelled to school by bike.


boy riding bike


How do you travel to school?


Let's have a go at the questions now.

What is EdPlace?

We're your National Curriculum aligned online education content provider helping each child succeed in English, maths and science from year 1 to GCSE. With an EdPlace account you’ll be able to track and measure progress, helping each child achieve their best. We build confidence and attainment by personalising each child’s learning at a level that suits them.

Get started
laptop

Try an activity or get started for free

  • National Tutoring Awards 2023 Shortlisted / Parents
    National Tutoring Awards 2023 Shortlisted
  • Private-Tutoring-WINNER-EducationInvestor-Awards / Parents
    Winner - Private Tutoring
  • Bett Awards Finalist / Parents
    Finalist
  • Winner - Best for Home Learning / Parents
    Winner - Best for Home Learning / Parents