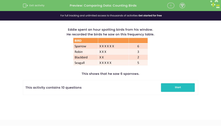
Eddie spent an hour spotting birds from his window.
He recorded the birds he saw on this frequency table.
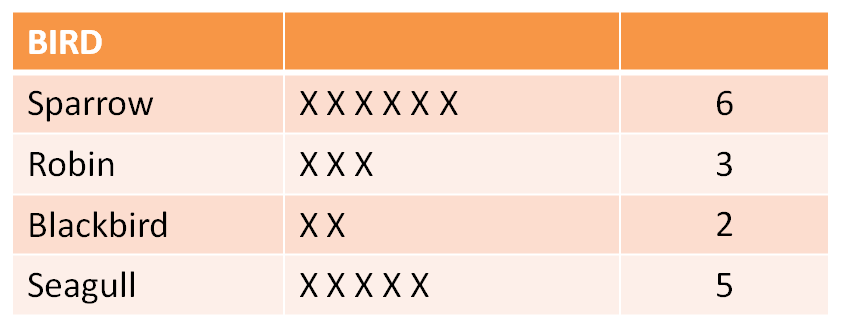
Each X represents a bird he spotted.
This shows that he saw 6 sparrows, 3, robins, 2 blackbirds, and 5 seagulls.
In this worksheet, students count and compare data relating to bird varieties.
Key stage: KS 1
Year: Year 2 Maths worksheets
Curriculum topic: Statistics
Curriculum subtopic: Totalling and Comparing Data
Difficulty level:
---- OR ---- Preview Activity
We're your National Curriculum aligned online education content provider helping each child succeed in English, maths and science from year 1 to GCSE. With an EdPlace account you’ll be able to track and measure progress, helping each child achieve their best. We build confidence and attainment by personalising each child’s learning at a level that suits them.
Get startedTry an activity or get started for free