Loading please wait

The smart way to improve grades

Comprehensive & curriculum aligned

Try an activity or get started for free

Count and Sort Data From a Pictogram

In this worksheet, students will read information from a table/pictogram.

'Count and Sort Data From a Pictogram' worksheet

Key stage:  KS 1

Year:  Year 2 Maths worksheets

Curriculum topic:   Statistics

Curriculum subtopic:   Charts and Diagrams

Difficulty level:  

Worksheet Overview

In this activity, we will read information from a table/pictogram.


Example

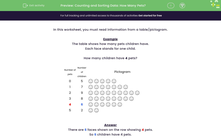
The table shows how many pets a group of children have.

Each face stands for one child.


How many children have 4 pets?


Number of
pets
Number of
children
Pictogram
0 5
1 7
2 9
3 8
4 6
5 2


Answer

There are 6 faces shown on the row showing 4 pets.

So 6 children have 4 pets.


Does that make sense?


Do you have any pets?


hamster on a hand


Let's have a go at the questions now?

What is EdPlace?

We're your National Curriculum aligned online education content provider helping each child succeed in English, maths and science from year 1 to GCSE. With an EdPlace account you’ll be able to track and measure progress, helping each child achieve their best. We build confidence and attainment by personalising each child’s learning at a level that suits them.

Get started
laptop

Try an activity or get started for free

  • National Tutoring Awards 2023 Shortlisted / Parents
    National Tutoring Awards 2023 Shortlisted
  • Private-Tutoring-WINNER-EducationInvestor-Awards / Parents
    Winner - Private Tutoring
  • Bett Awards Finalist / Parents
    Finalist
  • Winner - Best for Home Learning / Parents
    Winner - Best for Home Learning / Parents