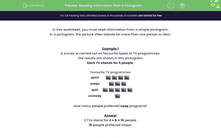
In this activity, we will read information from a simple pictogram.
In a pictogram, the picture often stands for more than one person or item.
Example 1
A survey is carried out on favourite types of TV programmes.
The results are shown in this pictogram.
Each TV stands for 5 people.
| Favourite TV programmes | |
| Sport |     |
| Soaps |    |
| Quiz |      |
| Comedy |  |
How many people preferred soaps?
Answer
Three TVs stands for 3 × 5 = 15 people.
15 people preferred soaps.

Example 2
A survey is carried out on favourite types of TV programmes.
The results are shown in this pictogram.
Each TV stands for 2 people.
| Favourite TV programmes | |
| Sport |    |
| Soaps |    |
| Quiz |     |
| Comedy |   |
How many people took part in the survey?
Answer
Count the TVs.
There are 12 TVs in total.
12 TVs stands for 12 × 2 = 24 people.
24 people took part in the survey.
How do you feel about trying some questions on this now?


