In this activity, we're going to be reading and comparing data presented to us in a table format.
Data is a word that we use to describe information.
Data is often presented in a table - can you think of some examples?
Some examples would be a train timetable, distances between places, temperature...you can probably think of lots more.
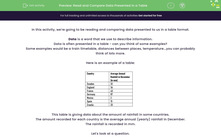
Here is an example of a table:
This table is giving data about the amount of rainfall in some countries.
The amount recorded for each country is the average annual (yearly) rainfall in December.
The rainfall is recorded in mm.
Let's look at a question.
Example
What is the difference in rainfall between Spain and Croatia?
Answer
Let's first find the rainfall for each of these countries.
Spain = 15 mm
Croatia = 23 mm
The difference between these two measures is 8 mm (23 - 15 = 8)

Good luck with the following questions.


.PNG)


