


In this activity, we're going to be learning how to read and compare information presented in line graphs.
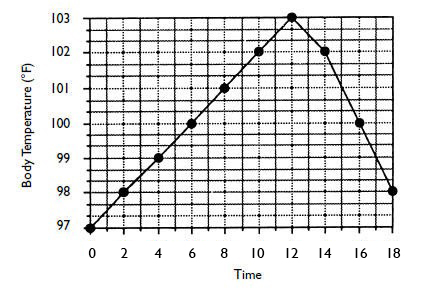
The following line graph shows the temperature of someone over a period of time.
The horizontal line represents the time (x-axis)
The vertical line represents the temperature in Fahrenheit ºF (y-axis) - note that we don't use Fahrenheit very often - it is more usual to use degrees Celsius ºC
The labels on the vertical and horizontal lines tell us what the information is representing.
The title tells us what the graph is representing.
A line graph showing body temperature over time (minutes)
Let's have a look at a question using this line graph.
Example
What was the difference in temperature after 2 minutes?
The x-axis starts at 0. This is representing time in this graph.
In this graph, the y-axis starts at 97ºF which is normal body temperature.
We travel along the x-axis to 2 minutes and then read up to the graph line (there is a black dot here).
We can see that the temperature is 98ºF
We can see that the temperature has gone up by 1ºF
Answer
The difference in temperature after 2 minutes is 1ºF

Interesting point: If this were a real temperature chart for somebody, they would be feeling pretty poorly with such a sudden increase in temperature! Some medicine would definitely be needed!
Good luck with the following questions.


