

In this activity, we're going to be answering questions involving finding the difference and comparing information provided in line graphs.
A line graph provides continuous data that changes over time.
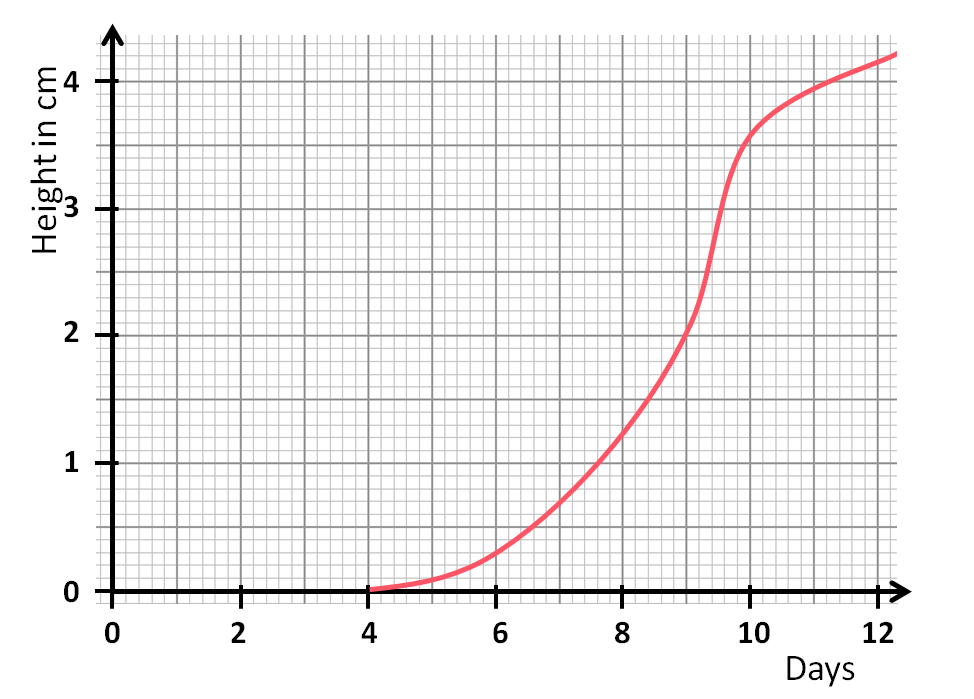
Here is a line graph that is showing the height some seeds grew over a period of time.

The x-axis shows the time in days.
The y-axis is the height in cm.
Let's look at a question.
Example
What was the difference in height of the seedlings between 4 and 6 days?
We need to look carefully at the scale to answer this question.
We can find 4 and 6 days on the x-axis easily.
After 4 days the seedlings are at 0 cm.
After 6 days the seedlings are at a height of 0.3 cm (each small square is 0.1 cm)
The difference in height is 0.3 cm.
Top Tips:
Read the questions carefully
Look at the scale.

Good luck with the following questions.


