In this activity, we'll be finding differences and comparing information presented in pictograms.
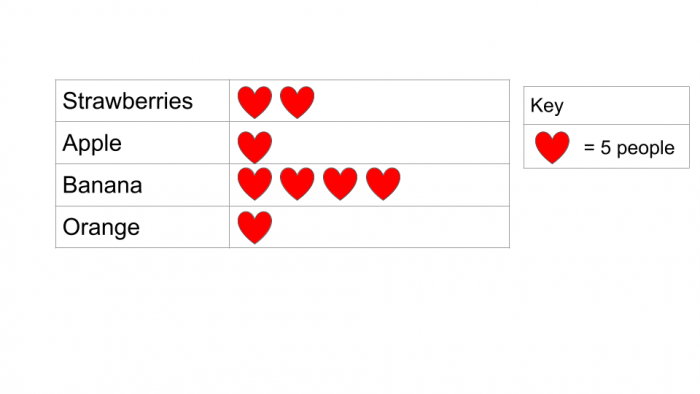
Let's look at a pictogram:
This pictogram is giving us information about people's favourite fruit.
We can see that each person has a choice of four fruits to select from.
The key is telling us that each heart shape represents 5 people.

Example
How many more people prefer bananas to oranges?
Answer
We can see that 5 people like oranges (1 heart = 5)
20 people like bananas best (4 hearts = 20)
We need to find the difference to reach the answer.
20 - 5 = 15
15 more people prefer bananas.

Top Tips:
Read the questions and pictograms carefully.
Sometimes we may be presented with a fraction of a shape which will represent that fraction of the number (half a heart would be 2½ people - we can't have half a person so it wouldn't work in this pictogram!)

Now it's your turn- good luck.


