
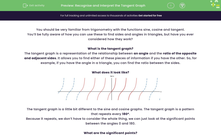

You should be very familiar from trigonometry with the functions sine, cosine and tangent.
You’ll be fully aware of how you can use these to find sides and angles in triangles, but have you ever considered how they work?
What is the tangent graph?
The tangent graph is a representation of the relationship between an angle and the ratio of the opposite and adjacent sides. It allows you to find either of these pieces of information if you have the other. So, for example, if you have the angle in a triangle, you can find the ratio between the sides.
What does it look like?
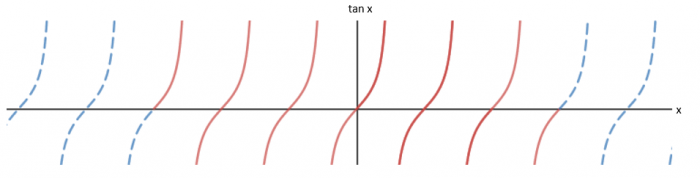
The tangent graph is a little bit different to the sine and cosine graphs. The tangent graph is a pattern that repeats every 180°.
Because it repeats, we don’t have to consider the whole thing, we can just look at the significant points between the angles 0 and 180.
What are the significant points?
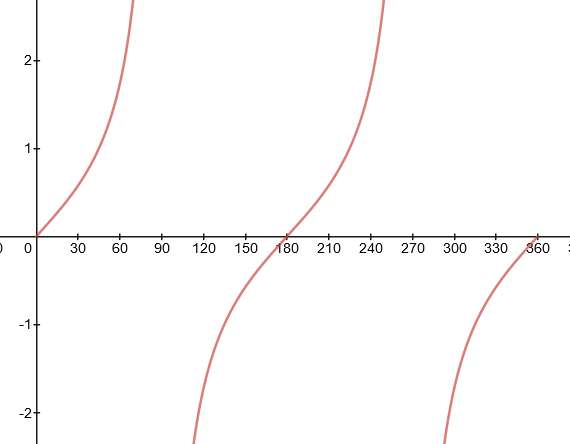
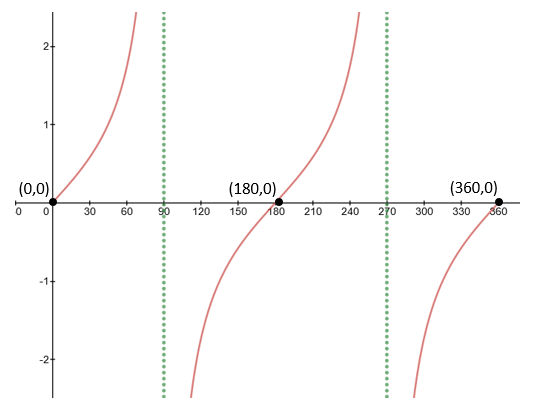
From this, we can see that there are some significant points we need to consider:
Unlike sine and cosine, the tangent graph has no maximum.
Intercepts: The function tan (x) crosses the x-axis at 0°, 180° and 360°.
Asymptotes: There is a point where tan (x) is mathematically impossible. This occurs at 90° (and every 180° before and after)
Think about why this is impossible - can you have two 90 degree angles in a triangle?
The two angle problem
What if a question asks you to give two possible angles?
Getting one is easy, you can just use the tan-1 function on your calculator. The problem is how do you find the other?
This is all about understanding the tangent graph.
Example:
There are two angles with tan (x) = 1.00 x1 = 45°. Find x2
To solve this, we need to look at the tangent graph:
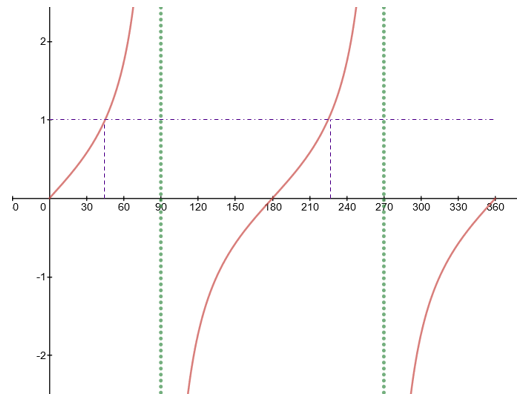
We can see here that the second angle is 225°. The reason behind this is that the tangent graph repeats every 180°.
Usefully, there is a nice little rule.
For a tangent graph: x2 = 180 + x1


