

The most important question you need to ask here is not about quadratics, it’s what does the word sketch actually mean?
A sketch has to be neat, done in pencil but doesn’t have to be measured.
So, when you sketch a quadratic, you don’t have to find all the values in a table, put these on etc.
You would have to do that if the question asked you to draw or plot the quadratic.
So can I draw any old graph then?
In a word, no. When you sketch a quadratic, it has to look like a quadratic graph and have the significant points roughly in the correct places and labelled with their exact value.
What are the significant points?
There are three significant points that you have to be able to find algebraically - the roots (solutions), the turning point (the vertex/minimum) and the y-intercept.

For the quadratic function y = f(x):
The roots are found by solving the equation f(x) = 0
The vertex is found by completing the square.
The intercept is found by putting x = 0 into the function.
If you are unsure about the methods to either solve the quadratic or complete the square, look at the activities 7956 and 7957 on using algebra to find roots and turning points before you attempt this activity.
Example:
Sketch the graph for the function y = x2 – 6x + 8
The roots: We could either use the quadratic formula or factorisation here to solve this.
Factorisation is quicker, so here goes:
On the x-axis, y = 0, so y = x2 – 6x + 8 → x2 – 6x + 8 = 0
x2 – 6x + 8 = 0 → (x – 2)(x – 4) = 0
Solving this gives x = 2 and x = 4
As coordinates these are (2,0) and (4,0)
The vertex: We start this process by completing the square for the function y = x2 – 6x + 8
y = x2 – 6x + 8 → y = (x - 3)2 – 1
To find the minimum point, we need to find the lowest value of y. Because a square cannot be negative, the smallest value happens when (x - 3)2 = 0
This gives the x value for the minimum point as x = 3.
When x = 3, y = -1. The minimum point of the graph is (3,-1)
The y-intercept
The y-intercept is where the line crosses the y–axis. At this point x = 0.
Putting x = 0 into the equation y = x2 – 6x + 8 gives y = 8.
The intercept is therefore at (0,8)
Putting this onto the graph
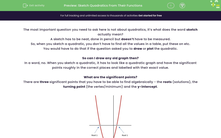
Step 1: Plot the points roughly onto a set of axes - notice that at this point, the graph has no numbers.
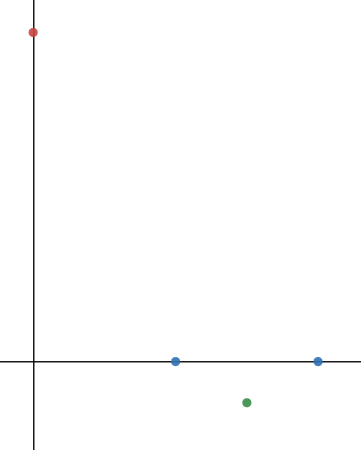
Step 2: Draw a smooth curve through these points.
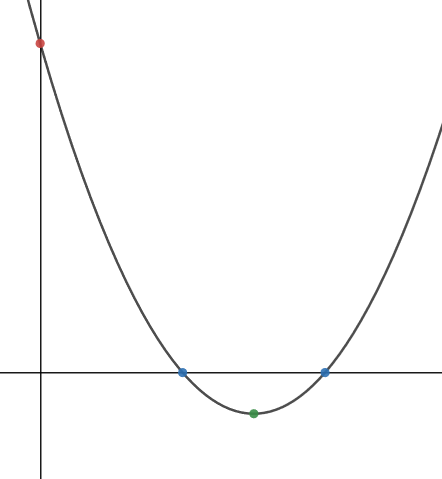
Step 3: Label the significant points.
Let's move on to some questions.


