

So how do scientists know that stimulants make you react faster? They conducted experiments! Doing experiments allows us to answer questions.

Let's consider the statement:
Stimulants affect human reaction time
When investigating something, we need to form a hypothesis, which is the scientific term for an idea about how something works or how it changes. You have to do experiments to see if your hypothesis (idea) is correct.
Our hypothesis might be 'caffeine will speed up reaction times because caffeine is a stimulant and speeds up messages in our nervous system.' We then test this idea using experiments.
Cola has caffeine in it, so we can use it to see if it has an affect on reaction time.
The stimulant is the factor we are investigating - this is known as the independent variable.
There are many ways to measure reaction times and one of these is using a ruler. This experiment involves measuring the time it takes to catch a ruler (the reaction time) before and after drinking a caffeine drink, like cola. This is known as the dependent variable.
Control variables are things we control so they don't interfere with our experiments. For example, if one student drinks half a glass of cola and another student has a whole glass, this could affect the results, as the amount of caffeine taken will be different.
Other control variables might be the length of the ruler, where the ruler is dropped from or where the person catching the ruler places their hand.
Scientists carry out experiments using a clear set of instructions called a method. This means that other scientists can use the same method to check findings. Before carrying out the method we have to list the equipment and resources needed:
Equipment
Ruler
Cola drink
Two volunteers: person B catching the ruler and person A dropping the ruler
Method
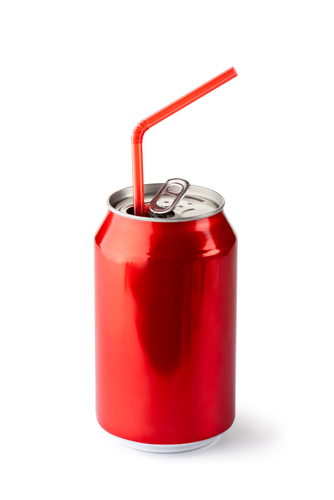
1. Person A must hold the ruler from an agreed height and drop it when they're ready (person B will not know exactly when this is).
2. Person B must wait with their fingers a certain distance from the ruler and catch it as it drops.
3. The distance the ruler falls through person B's hand is then noted on the ruler - this forms the basis of the reaction time.
4. Steps 2, 3 and 4 must be repeated at least twice more.
5. Person B should then drink an agreed volume of cola (for example 15 ml).
6. They should then wait an agreed length of time for the caffeine to take effect.
7. Repeat steps 2, 3, 4 and 5 again.
As we're doing our experiment, we should record our results in a clearly labelled and organised table. Below is an example of some results:
|
We calculate an average by adding all trials and dividing by the number of trials:
Trial 1 + Trial 2 + Trial 3 + Trial 4 + Trial 5 = Total
Total ÷ 5 = Average
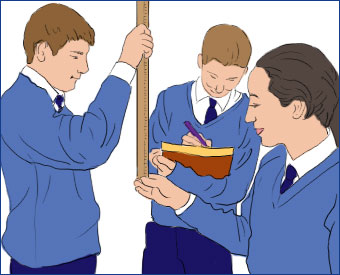
A results table allows us to spot any patterns or even any mistakes. We can then plot these results on a graph:
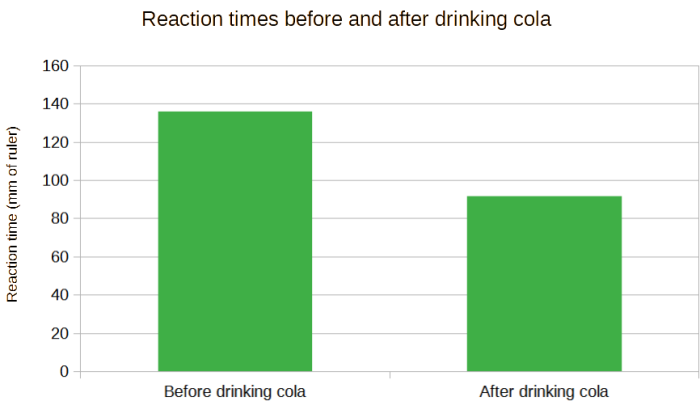
When plotting data on a graph, we have to first decide on a scale. We want to make sure the graph isn't squashed on our graph paper but is spaced out nice and large - the scale on the graph above is going up in 20's. We also make sure the bars are the same width.
Next, we draw and label axes correctly using a sharp pencil and a ruler, remembering to include units. The independent variable will always go on the x-axis (the horizontal one) and the dependent variable goes on the y-axis (the vertical one).
Once we've presented our data we can start to have a look at patterns.
From looking at the graph, we can see that before drinking cola, the average reaction time was 136 mm of ruler that passed through the hand before it was caught. After drinking cola, the average reaction time was quicker, at 92 mm. These results suggest that our hypothesis is correct - drinking cola does speed up reaction time.
In this activity, we will analyse results to find out if stimulants speed up reaction times.


