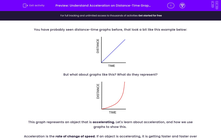

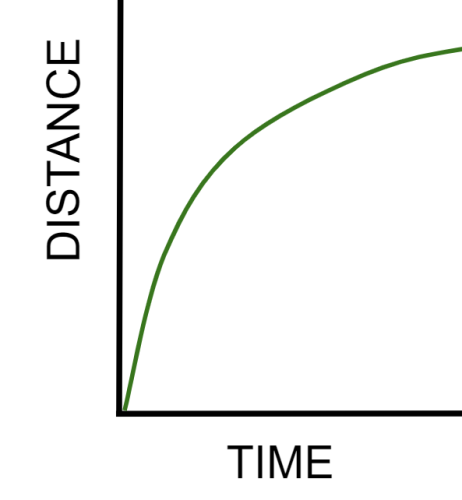
You have probably seen distance-time graphs before, that look a bit like this example below:
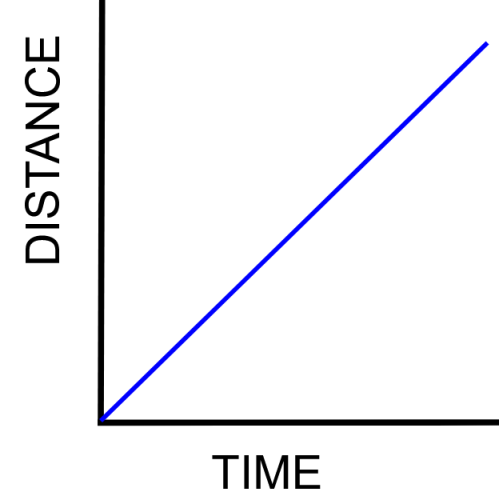
But what about graphs like this? What do they represent?
This graph represents an object that is accelerating. Let's learn about acceleration, and how we use graphs to show this.
Acceleration is the rate of change of speed. If an object is accelerating, it is getting faster and faster over time. The greater the acceleration, the more the object speeds up per second.
A similar term is deceleration. If an object decelerates, that means that it is getting slower and slower over time.
We can show acceleration with a distance-time graph. Here is the example from before.
As you can see, the graph shows a curve. Curved lines on distance-time graphs show acceleration (or deceleration).
But why do curves show acceleration?
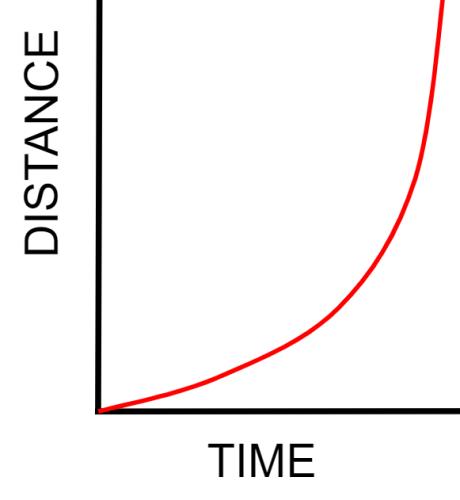
First, you might remember that the gradient (steepness) of a graph tells us the speed of the object.
In this example, object A and object B are both travelling at constant speeds. But object A is moving at a higher speed because it has a steeper gradient.
Look at the acceleration graph again. How does the gradient change?
The line gets steeper and steeper as time goes on. This must mean the object is getting faster and faster - it is accelerating!
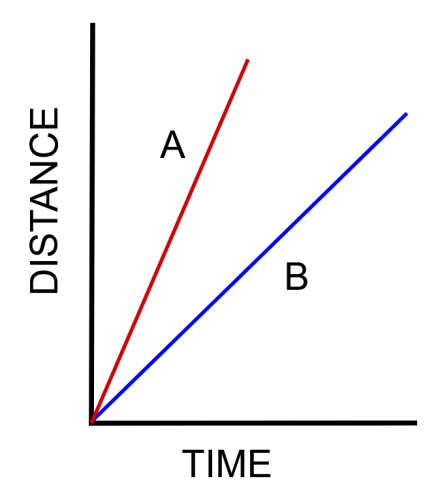
What might a graph of a decelerating object look like?
In this graph, you can see that the line is getting less steep as time goes on - it is getting flatter. This means that the object is getting slower and slower, it is decelerating.
Now we are going to practise interpreting more distance-time graphs, and how to use them to make calculations.

Look carefully at the graph above.
In section A, the object is accelerating.
In section B, the object is stationary.
In section C, the object is moving at a constant speed.
In section D, the object is decelerating (and moving backwards).
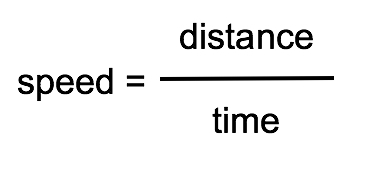
What is the speed of the object in section C? Remember the equation for speed:
What is the distance travelled by the object, in section C? We can look at the y-axis to check.
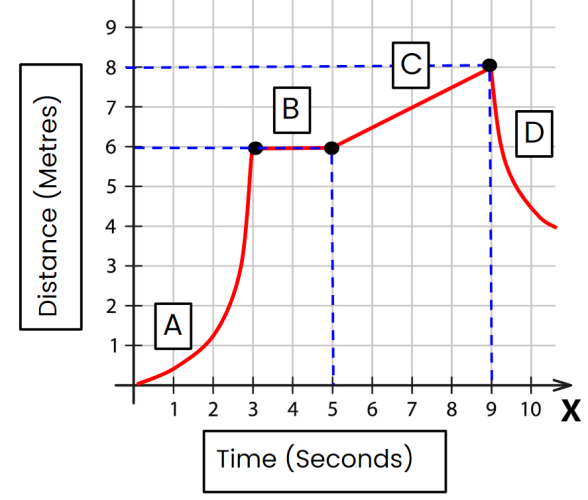
The object starts section C at 6 metres and ends at 8 metres. So, it travels a distance of 2 metres.
How much time did this take?
The object starts section C at 5 seconds and ends at 9 seconds. So, the time taken is 4 seconds.
What is the speed of the object during section C?
Speed (m/s) = Distance (m) ÷ Time (s)
Speed (m/s) = 2 m ÷ 4 s = 0.5 m/s
Now let's apply what we have learnt to some questions!