


Distance-time graphs help us to develop our understanding of the concepts of speed and motion. If we can interpret a distance-time graph accurately, we can understand the journey of an object.
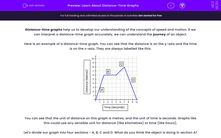
Here is an example of a distance-time graph. You can see that the distance is on the y-axis and the time is on the x-axis. They are always labelled like this.

You can see that the unit of distance on this graph is metres, and the unit of time is seconds. Graphs like this could use any sensible unit for distance (like kilometres) or time (like hours).
Let's divide our graph into four sections - A, B, C and D. What do you think the object is doing in section A?
In section A, the object's distance is increasing at a constant rate. That means that it is moving at a constant speed. The object travels 6 metres in 2 seconds.
What about section B? In this section, the distance isn't changing. That means the object is not moving - it is stationary.
Compare section C to section A. What do you think is happening in section C?
In section C, just as in section A, the object is moving at a constant speed. However, the line looks different, it is less steep. In other words, we say it has a lower gradient.
The lower the gradient, the lower the speed.
A steep line, or high gradient, means a higher speed.
The last section in our graph is section D. In this section, the object is also moving at a constant speed. But this time, the line is going 'downwards' - we say that it is negative.
A negative line like this in a distance-time graph means that the object is going backwards, towards its starting point.
Here is a simple distance-time graph showing the motion of two objects. Which object do you think is moving faster?
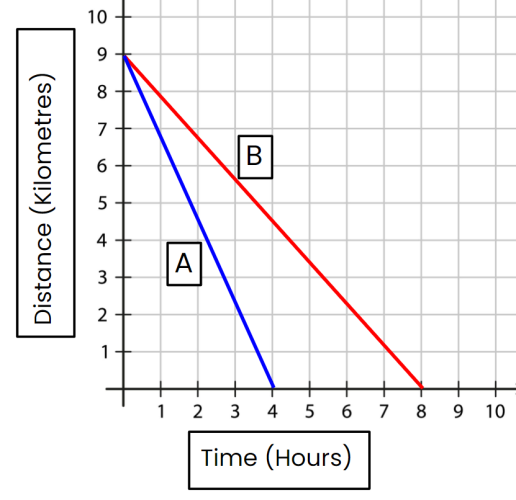
Object A has a higher speed. The line is steeper, which means it has a higher gradient. Remember, the higher the gradient, the faster the object.
You can double-check your answer if you aren't sure - you can see that object A and object B both travelled 9 kilometres. Object A took 4 hours, and object B took 8 hours. So object A must have been faster because it travelled the same distance in less time.
Now let's check our understanding with some questions!


