


Distance-time graphs are a specific type of graph used in science, that can give us information about a journey. In these graphs, the distance is always on the y-axis and the time is always on the x-axis.
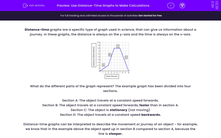
What do the different parts of the graph represent? The example graph has been divided into four sections.
Section A: The object travels at a constant speed forwards.
Section B: The object travels at a constant speed forwards, faster than in section A.
Section C: The object is stationary (not moving)
Section D: The object travels at a constant speed backwards.
Distance-time graphs can be interpreted to describe the movement or journey of an object - for example, we know that in the example above the object sped up in section B compared to section A, because the line is steeper.
We can also use these graphs to make calculations, for example, to find the distance travelled in a journey, the time taken, or the average speed of an object.
Let's look at our example graph again.
We can use the graph to determine the distances travelled by the object.
For example, what distance was travelled in section B?
In section B, the object started at 2 km and ended at 8 km. So, during this section, the object travelled for 6 km.
How much time did it take for the object to travel that 6 km distance?
In section B, the time started at 3 hours and ended at 5 hours. So, during this section, the object travelled for 2 hours.
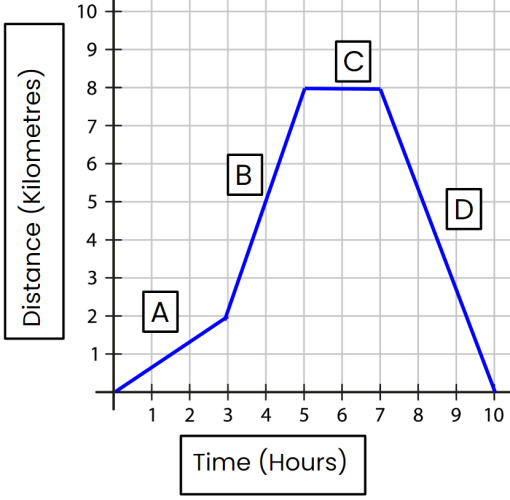
We can also use distance-time graphs to calculate the average speed of objects. You might remember the equation for speed:
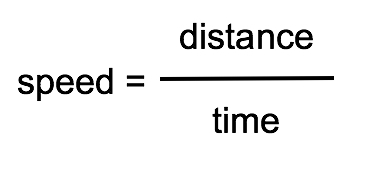
Here is another distance-time graph. What is the speed of the object?
Look at the y-axis. The object travels 20 metres.
Look at the x-axis. The object travels for 10 seconds.
Speed (m/s) = Distance (m) ÷ Time (s)
Speed (m/s) = 20 m ÷ 10 s = 2 m/s
It's important to check the units on the axes - they won't always be metres and seconds. Take that into account when you do calculations, as it will affect the unit of speed that you will need to use.
Now that you know a little more about calculations based on distance-time graphs, let's try some questions!


