Here is a block graph, showing the favourite fruits of the children in Eddie's class.
One block represents one child.
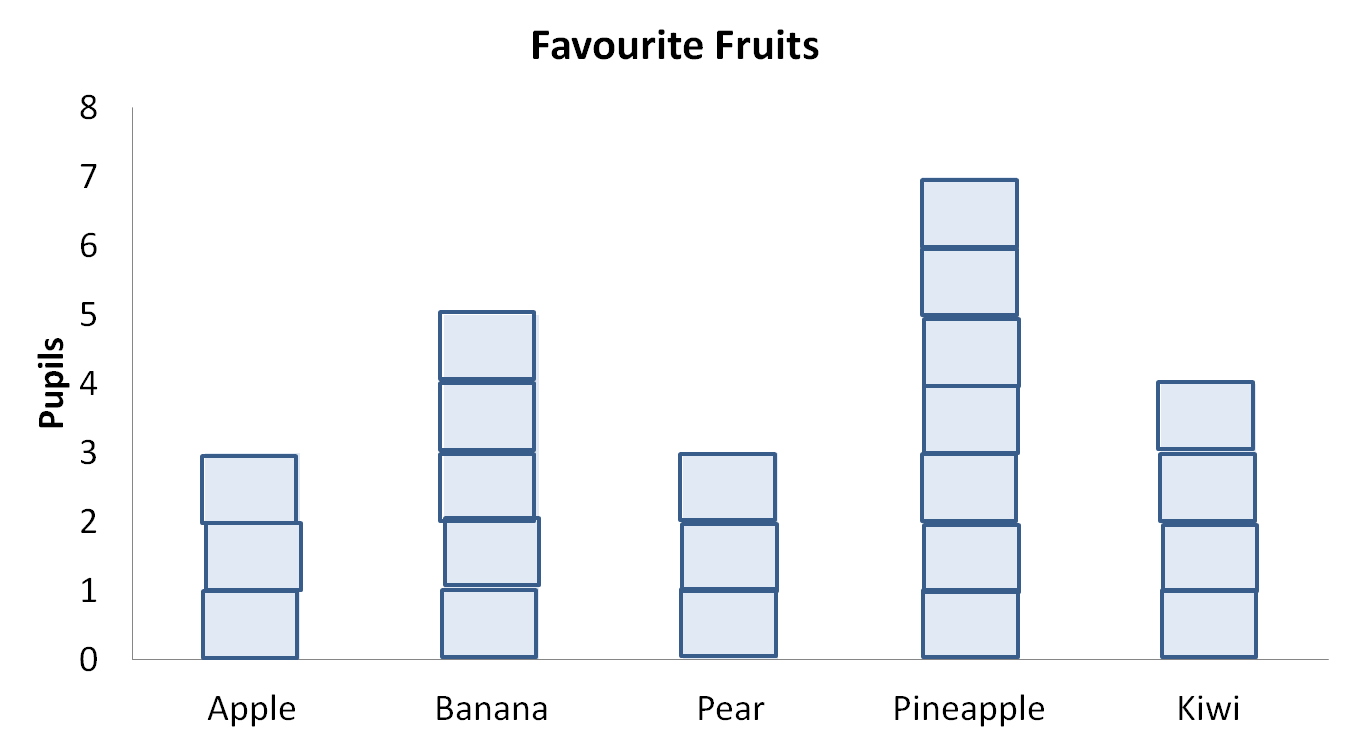
The Kiwi column is 4 blocks high.
This means that 4 children chose Kiwi as their favourite fruit.
In this worksheet, students read information from a block graph and then answer questions.
Key stage: KS 1
Curriculum topic: Statistics
Curriculum subtopic: Counting and Sorting Data
Difficulty level:
Sign up for a £1 trial so you can track and measure your child's progress on this activity.
We're your National Curriculum aligned online education content provider helping each child succeed in English, maths and science from year 1 to GCSE. With an EdPlace account you’ll be able to track and measure progress, helping each child achieve their best. We build confidence and attainment by personalising each child’s learning at a level that suits them.
Start your £1 trial