

You should be very familiar from trigonometry with the functions sine, cosine and tangent.
You’ll be fully aware of how you can use these to find sides and angles in triangles, but have you ever considered how they work?
What is the cosine graph?
The cosine graph is a representation of the relationship between an angle and the ratio of the adjacent and hypotenuse. It allows you to find either of these pieces of information if you have the other. So, for example, if you have the angle in a triangle, you can find the ratio between the sides.
What does it look like?
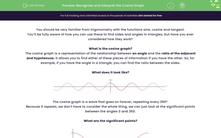
The cosine graph is a wave that goes on forever, repeating every 360°.
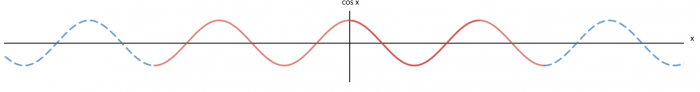
Because it repeats, we don’t have to consider the whole thing, we can just look at the significant points between the angles 0 and 360.
What are the significant points?
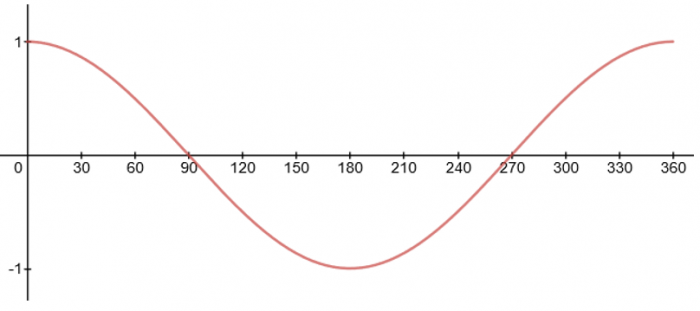
From this, we can see that there are some significant points we need to consider:
The maximum: The highest value that cos (x) can have is 1. This occurs at 0° and 360°.
The minimum: The lowest value that cos (x) can have is -1. This occurs at 180°.
Intercepts: The function cos (x) crosses the x-axis at 90° and 270°.
The two angle problem
What if you are asked to find two possible angles between 0 and 360?
Getting one is easy, you can just use the cos-1 function on your calculator. The problem is how do you find the other?
This is all about understanding the cosine graph.
Example:
There are two angles with cos (x) = 0.5, x1 = 60°. Find x2
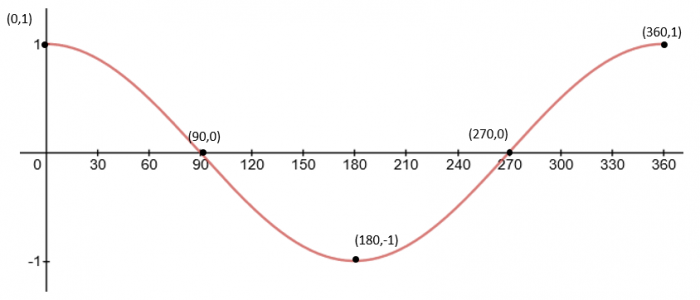
To solve this, we need to look at the cosine graph:
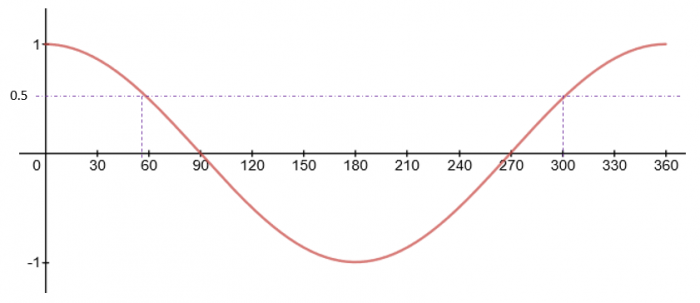
We can see here that the second angle is 300°. The reason for this is that the cosine graph is symmetrical between 0 and 360.
Usefully, there is a nice little rule.
For a cosine graph: x2 = 360 – x1


