


If you are plotting a graph, you are creating a visual representation of the link between the values of x and y for a given function.
When plotting graphs, there is a method you are expected to use (especially when plotting graphs that are not linear) called the table of values (TOV).
For quadratic graphs, the method you use will always be the same:
Step 1: Complete the table of values
Step 2: Plot the points
Step 3: Draw the curve
Example:
Plot the quadratic graph for y = x2 – 4x + 1 for -1 ≤ x ≤ 5
The first thing you need to get your head round here is what the question actually means:
y = x2 – 4x + 1 for -1 ≤ x ≤ 5 just means take the numbers -1, 0, 1, 2, 3, 4 and 5 and substitute them into the equation y = x2 – 4x + 1
Step 1: Complete the table of values to find the points
You will normally be given the table, if not, just draw one somewhere on your page:
|
x |
-1 |
0 |
1 |
2 |
3 |
4 |
5 |
|
y |
|
|
|
|
|
|
|
When filling this in, take each value of x (starting at -1) and substitute it into the function to get the value of y:
For x = -1: y = (-1)2 – 4(-1) + 1 = 1 + 4 + 1 = 6
For x = 0: y = (0)2 – 4(0) + 1 = 1
And so on…
You should eventually get the following table:
|
x |
-1 |
0 |
1 |
2 |
3 |
4 |
5 |
|
y |
6 |
1 |
-2 |
-3 |
-2 |
1 |
6 |
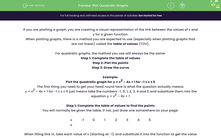
Step 2: Plot the points
When you a plotting a graph, you need to take these values of x and y and plot them as coordinates:
|
x |
-1 |
0 |
1 |
2 |
3 |
4 |
5 |
|
y |
6 |
1 |
-2 |
-3 |
-2 |
1 |
6 |
|
|
(-1,6) |
(0,1) |
(1,-2) |
(2,-3) |
(3,-2) |
(4,1) |
(5,6) |
Once you have these, you can then plot them on a graph (which once again, you will probably be given):
When you are plotting the points, you can technically use anything (such as dots or crosses) to indicate the points. Using crosses is probably best because it is easier to see where the points are plotted when you get to the next step.
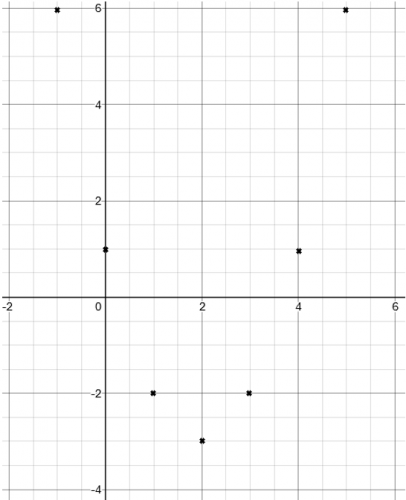
Step 3: Draw the curve
This is the part where students commonly lose a mark.
There are a number of rules you have to follow:
The curve needs to be a single, smooth curve.
The graph must pass through all the points.
Getting this correct can be quite difficult so you need to practise.
Let's try some questions now.


