

Solving quadratic inequalities can seem like a daunting task, but we just need to break these questions down and choose the best approach from our options.
To be able to solve these, you will need to be able to solve quadratic equations (either by factorising or using formula) and sketch quadratic graphs.
Let's look at a couple of examples to see how we can approach these.
e.g. Solve the inequality x2 - 2x - 3 ≥ 0.
Step 1:
Imagine that this is an equation and solve it as normal using either factorisation or the quadratic formula:
x = -1 and x = 3
So if we draw the graph for y = x2 - 2x - 3, these two points are where the graph crosses the x axis.
Step 2:
Sketch the quadratic graph:
.PNG)
Step 3:
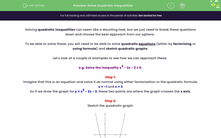
Identify the parts of the graph that satisfy the inequality: x2 - 2x - 3 ≥ 0
Since we are looking for the points that are greater than or equal to 0, we need to highlight the following sections (shown in red):
We can see that there are two sections highlighted in red.
This means we need two inequalities to describe the solutions to our inequality:
x ≤ -1 and x ≥ 3
e.g. Solve the inequality x2 - x - 20 < 0.
Step 1:
Imagine that this is an equation and solve it as normal using either factorisation or the quadratic formula:
x = -4 and x = 5
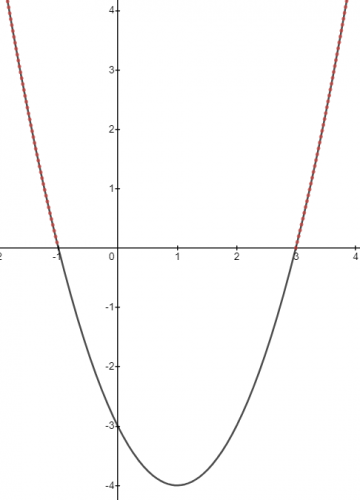
So if we draw the graph for y = x2 - x - 20, these two points are where the graph crosses the x axis.
Step 2:
Sketch the quadratic graph:
Step 3:
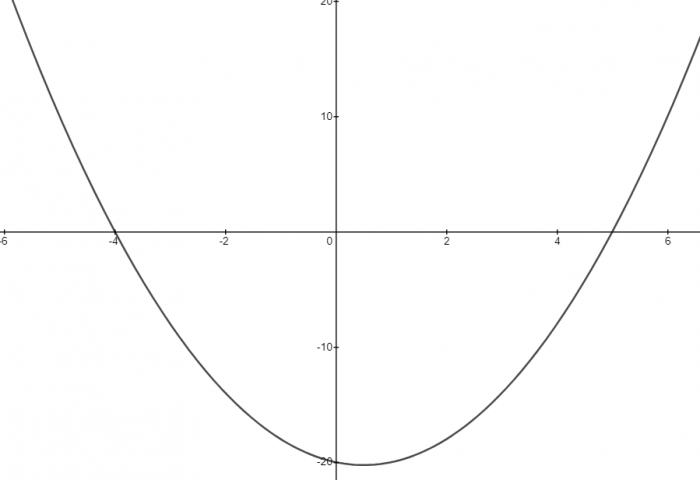
Identify the parts of the graph that satisfy the inequality: x2 - x - 20 < 0
Since we are looking for the points that are less than 0, we need to highlight the following section (shown in red):
We can see that there is only one section highlighted in red.
This means we only need one inequality to describe the solutions to our inequality:
-4 < x < 5
In this activity, we will find solutions to quadratic inequalities by solving them as quadratic equations and interpreting quadratic graphs.


