When we compare we are looking for things that are the same and things that are different.
It's a bit like spotting a pattern, or spotting when there isn't a pattern!
In this activity, we will try using some tables and graphs to tell us more about the seasons and help us to compare them!
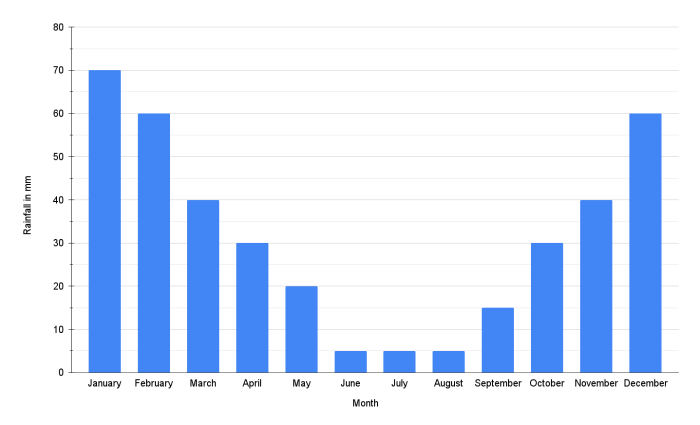
Look at the graph below.

It shows us the rainfall in each month.
Can you tell which month had the most rain? Or the least rain? Do you know which season that was in?

Great try!
The most rain was in January in the middle of winter! We can see that there was 70 mm of rain.
The least rain was in August at the height of summer, when there was only 5 mm or less, of rain.
In these questions, we will use graphs and what we know about the seasons, to help us to compare them!


